Stakeholders in the Texas transportation system need reliable research data to guide future development. Whether it’s choosing the mix of projects to prioritize to increase safety and mobility for Texans or crafting policy that efficiently, effectively encourages the state’s economic development, knowing where the state is already headed is a first step in building a responsive transportation system of the future that best serves the Lone Star State.
As part of a PRC-funded study, researchers in TTI’s Infrastructure Investment and Analysis Program have developed a set of economic indicators that shed light on the development of transportation in Texas. These indicators are illustrated by 21 graphs with notes explaining their significance in showing trends in direct and indirect categories.
Direct Transportation Indicators
These indicators are directly related to transportation in Texas. These range from vehicle miles traveled (VMT)—which directly measures miles traveled by vehicles on Texas roads—to airport and seaport activity to fuel tax revenue, which represents a major transportation funding source in the state.
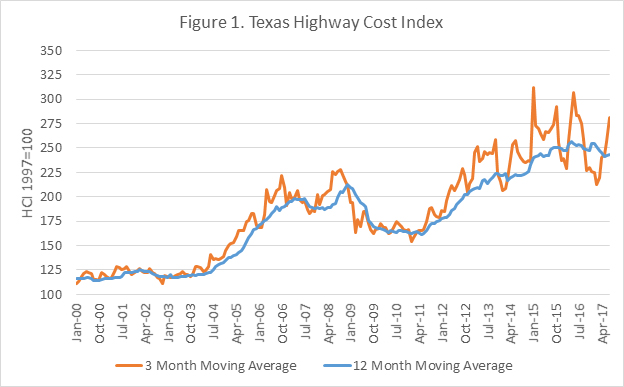
Figure 1. Texas Highway Cost Index
The Highway Cost Index shows inflation of highway construction costs over time. This can be used to compare the cost of a highway construction project from one year to the next. The index includes construction commodities such as steel, cement, and fuel. The index is reported as a monthly average, a three-month moving average, and a twelve-month moving average.
This is the number of VMT per month on all Texas roadways. This shows the overall demand placed on the Texas road network and greatly affects the amount of revenue generated by the motor fuels tax.

Figure 3. Texas Annual Fuel Tax Revenue
This figure shows the total fuel tax collected by Texas annually. The state fuel tax is 20 cents per gallon of diesel and gasoline. Of the revenue collected, 75 percent is allocated to the state highway fund, while 25 percent is allocated to education.
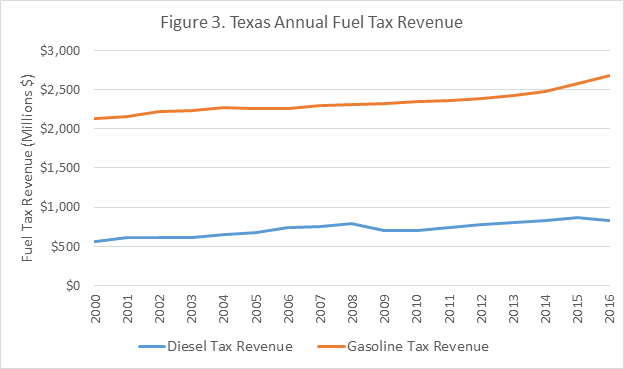
Figure 4. Texas Monthly Fuel Tax Revenue
This figure shows the fuel tax collected by Texas each month. The state fuel tax is 20 cents per gallon of diesel and gasoline. Of the revenue collected, 75 percent is allocated to the state highway fund, while 25 percent is allocated to education.

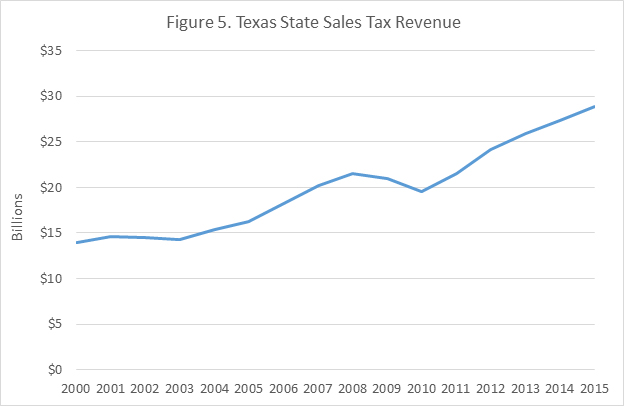
Figure 5. Texas State Sales Tax Revenue
This figure shows the total state sales tax collected annually by Texas. This revenue is allocated to the state general fund, of which a portion is then allocated to the Texas Department of Transportation (TxDOT).
This figure shows total trade across major Texas ports each year. This includes imports, exports, and domestic cargo.
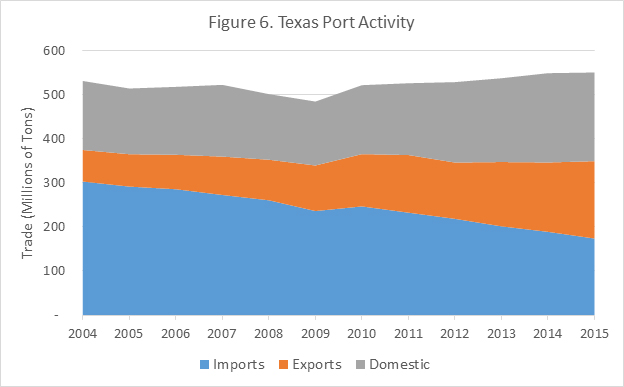
Figure 7. Texas Major Airports Monthly Enplanements
This figure shows the total number of enplanements per month at each major airport in Texas. Enplanements are defined as the number of passengers who depart from an airport. The portion labeled “Rio Grande Valley” is not one airport, but rather the sum of all enplanements from McAllen-Miller International Airport, Valley International Airport (Harlingen), and Brownsville/South Padre Island International Airport. The airports shown in the figure account for over 95 percent of all enplanements in the state.
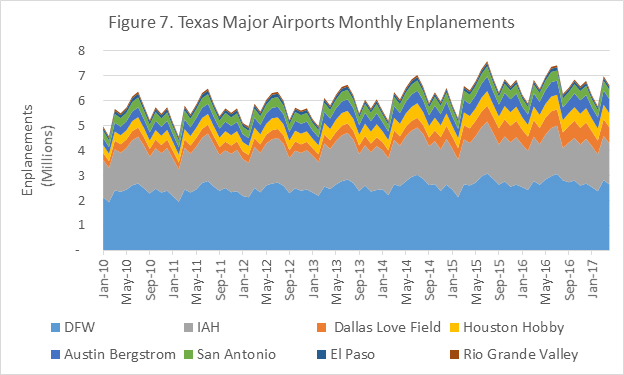
Figure 8. Texas Major Airports Monthly Cargo
This figure shows the metric tons of freight and mail entering or departing from each airport each month.
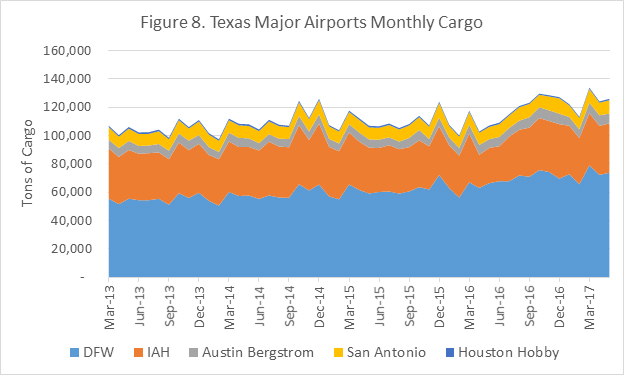
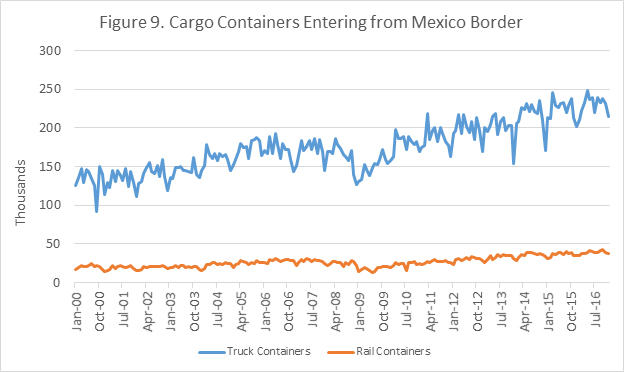
Figure 9. Cargo Containers Entering From Mexico Border
This figure shows the number of loaded truck and rail containers entering Texas from Mexico each month.
Indirect Transportation Economic Indicators
The following figures indirectly affect transportation activity in Texas. Generally, these are broad economic measures that drive transportation demand in the state or affect transportation-related tax revenues.
Energy Sector Indicators
These indicators focus on the Texas economy’s energy sector, specifically oil. The oil gas severance tax directly contributes to the highway fund, when the preset revenue threshold is exceeded. Additional, higher fuel prices have the potential to depress VMT, reducing fuel tax revenue. Higher levels of oil production (specifically, through hydraulic fracturing) put higher stress on roadways within oil fields.
Several figures reference WTI. WTI stands for West Texas Intermediate and is the type of crude oil used as the benchmark for oil pricing on the New York Mercantile Exchange. Typically, when the media reports the price of oil as x dollars, they are referring to the price of a barrel of WTI.
Figure 10. Fuel Prices and WTI
These are the average monthly gas and diesel prices at the pump as reported by the U. S. Energy Information Administration (EIA). They do not report a diesel price for Texas; thus, the Gulf Coast region price, which includes Texas, was used. Higher fuel prices have the potential to reduce travel demand, thus reducing fuel tax revenues.
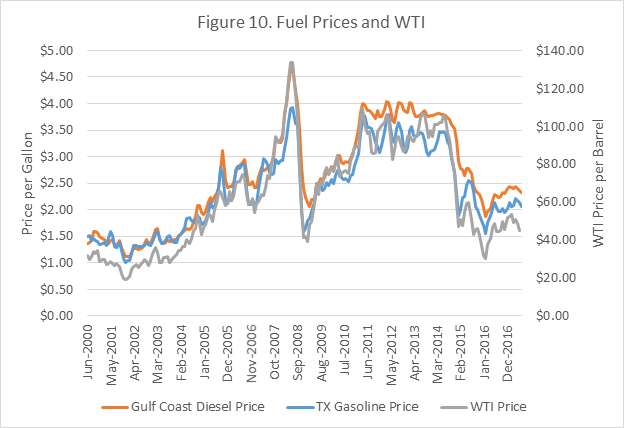
Figure 11. Texas Active Rigs vs. WTI Price
This figure shows the average weekly WTI price and the number of active drilling rigs in Texas. The number of rigs counts horizontal, directional, and vertical drilling rigs. A drilling rig is the actual machinery used to drill a well (not to be confused with the number of active wells). Knowing the change in the number of rigs is useful for observing future trends in production. Actual production will lag behind the active rig count.

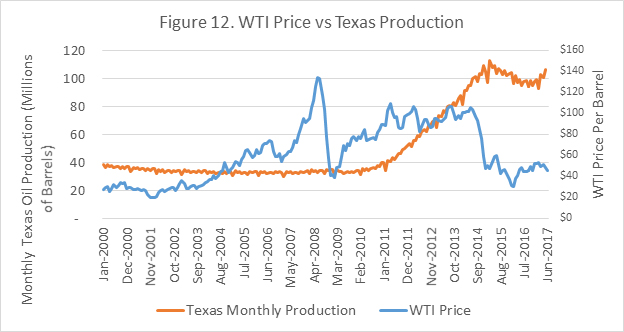
Figure 12. WTI Price vs. Texas Production
This figure shows the monthly average price of a barrel of WTI, compared to the number of barrels of oil produced in Texas each month. Production and price both determine the amount of revenue brought in by the severance tax, a portion of which is allocated to the highway fund.
Housing Sector Indicators
These indicators focus on the housing sector of the Texas economy. Changes in the housing market reflect general economic trends and can suggest future changes in VMT.
Figure 13. Monthly Texas Home Sales
This figure shows the total number of home sales in Texas each month, as well as the median price and average price of these sales.
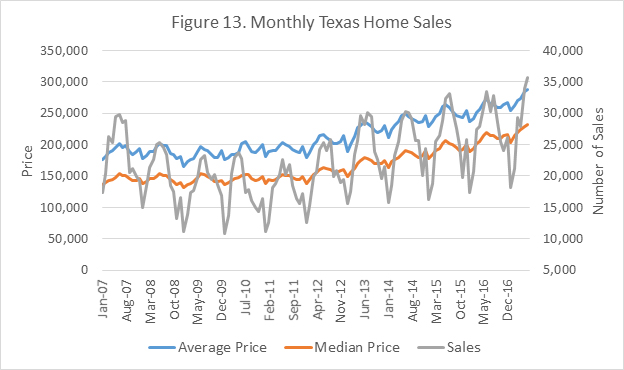
Figure 14. Texas Monthly SF Permits
This figure shows the number of building permits issued for single family homes each month, as well as the average value of these homes.
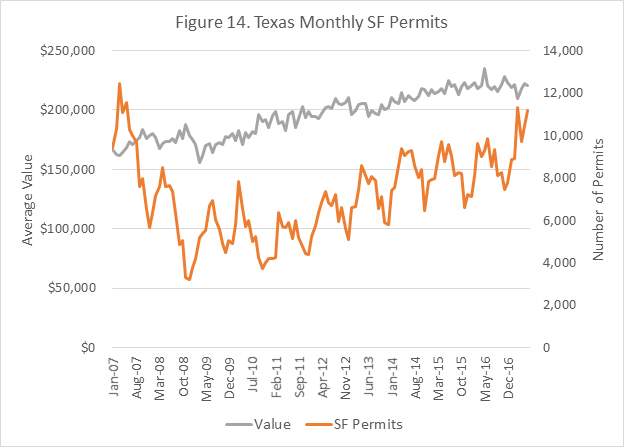
Figure 15. Texas Months of Inventory
The Texas Month of Inventory is calculated by the Texas A&M Real Estate Center. The Months of Inventory is equal to the number of current home listings, divided by the average number of sales per month, over the last year. Thus, the Months of Inventory shows the number of months that would be needed to clear the current supply of homes from the market.

Figure 16. Mortgage and Federal Funds Rate
This figure shows the average 30-year mortgage rate and the Federal Funds Rate. The Federal Funds Rate is set by the Federal Reserve and is the rate at which the Federal Reserve lends money to commercial banks. The Federal Reserve determines this rate based on economic conditions and other factors.
The mortgage rate is the monthly average rate of a 30-year fixed-rate mortgage. The Federal Home Loan Mortgage Corporation, also known as Freddie Mac, conducts a monthly survey of lenders in order to determine the average mortgage rate.

General Economic Indicators
Similar to the housing market, these indicators can drive changes in VMT. For example, higher employment means that there will be higher travel demand at peak travel times.
Figure 17. Employment Growth Rate by MSA
This figure shows the percent change in employment (total jobs) from the same month of the previous year, for each metropolitan statistical area (MSA). For example, a 4 percent increase for Austin in October 2014 means that there are 4 percent more jobs in Austin than there were in October 2013.
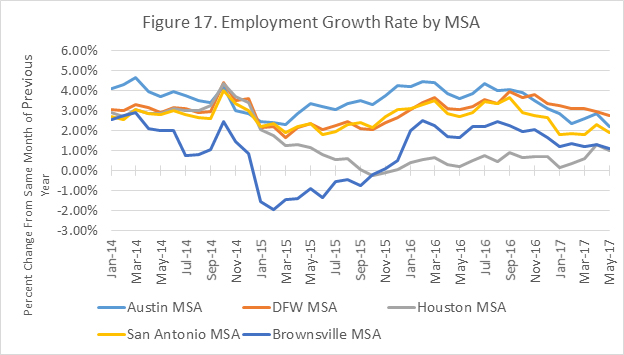
Figure 18. Texas Monthly Employment Growth Rate
Like the previous figure, this figure shows the change in employment from the same month of previous year for Texas and the entire country.
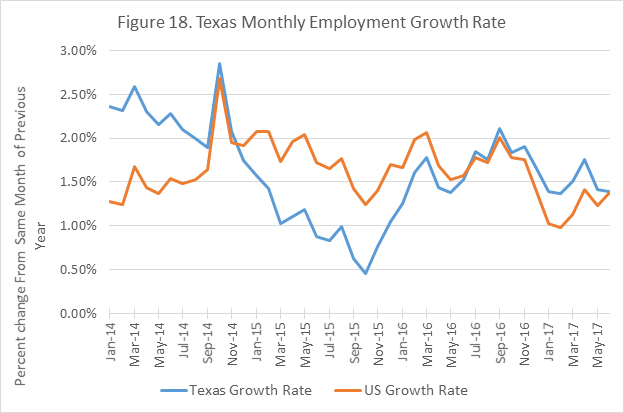
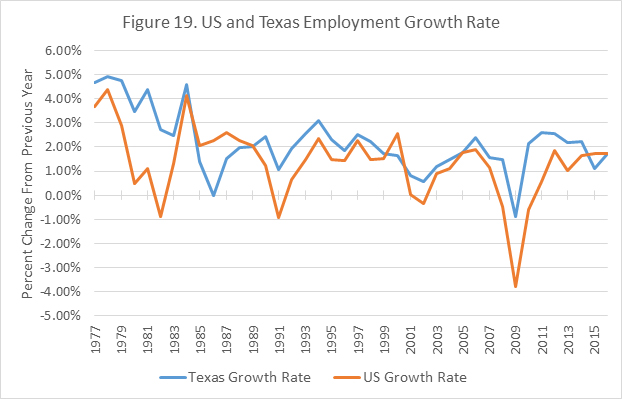
Figure 19. US and Texas Annual Employment Growth Rate
This figure shows the change in employment from the previous year for Texas and the United States.
This figure shows the total number of jobs in Texas per month.
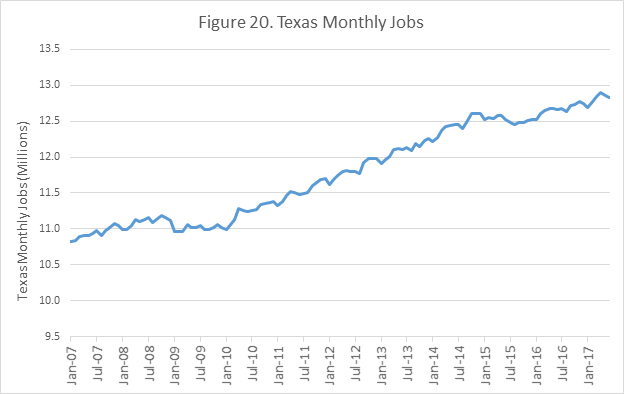
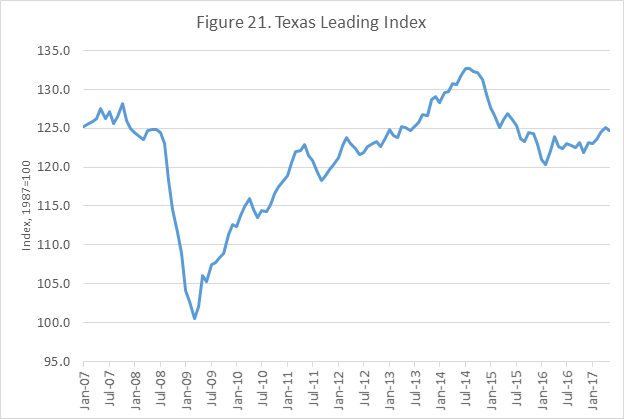
Figure 21. Texas Leading Index
From the Federal Reserve Bank of Dallas: “The Texas Leading Index is a single summary statistic that sheds light on the future of the state’s economy. The index is a composite of eight leading indicators—those that tend to change direction before the overall economy. They include the Texas value of the dollar, U.S. leading index, real oil price, well permits, initial claims for unemployment insurance, Texas stock index, help-wanted index and average weekly hours worked in manufacturing.”